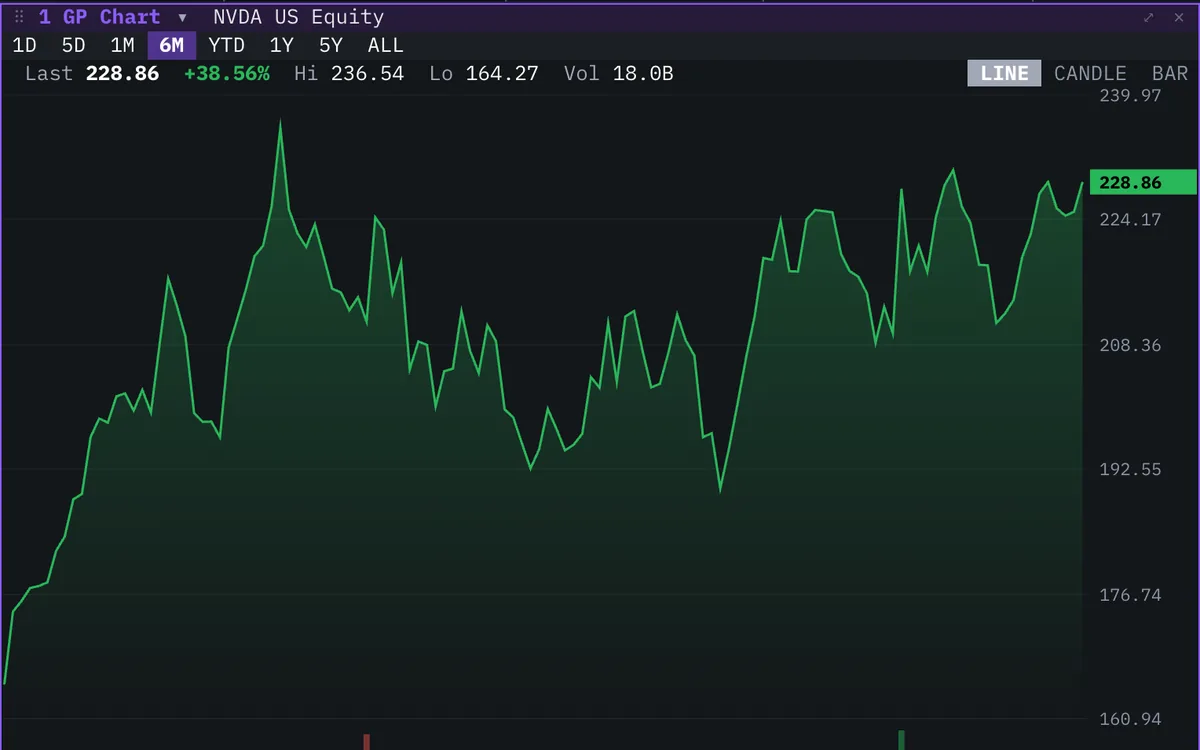
GP
Chart
Price graph
A keyboard-first terminal for stocks, crypto, macro and prediction markets. Priced in dollars, bitcoin or sats, and trading on your Roxom account.
14 days free · cancel any time · free with $20,000+ at Roxom
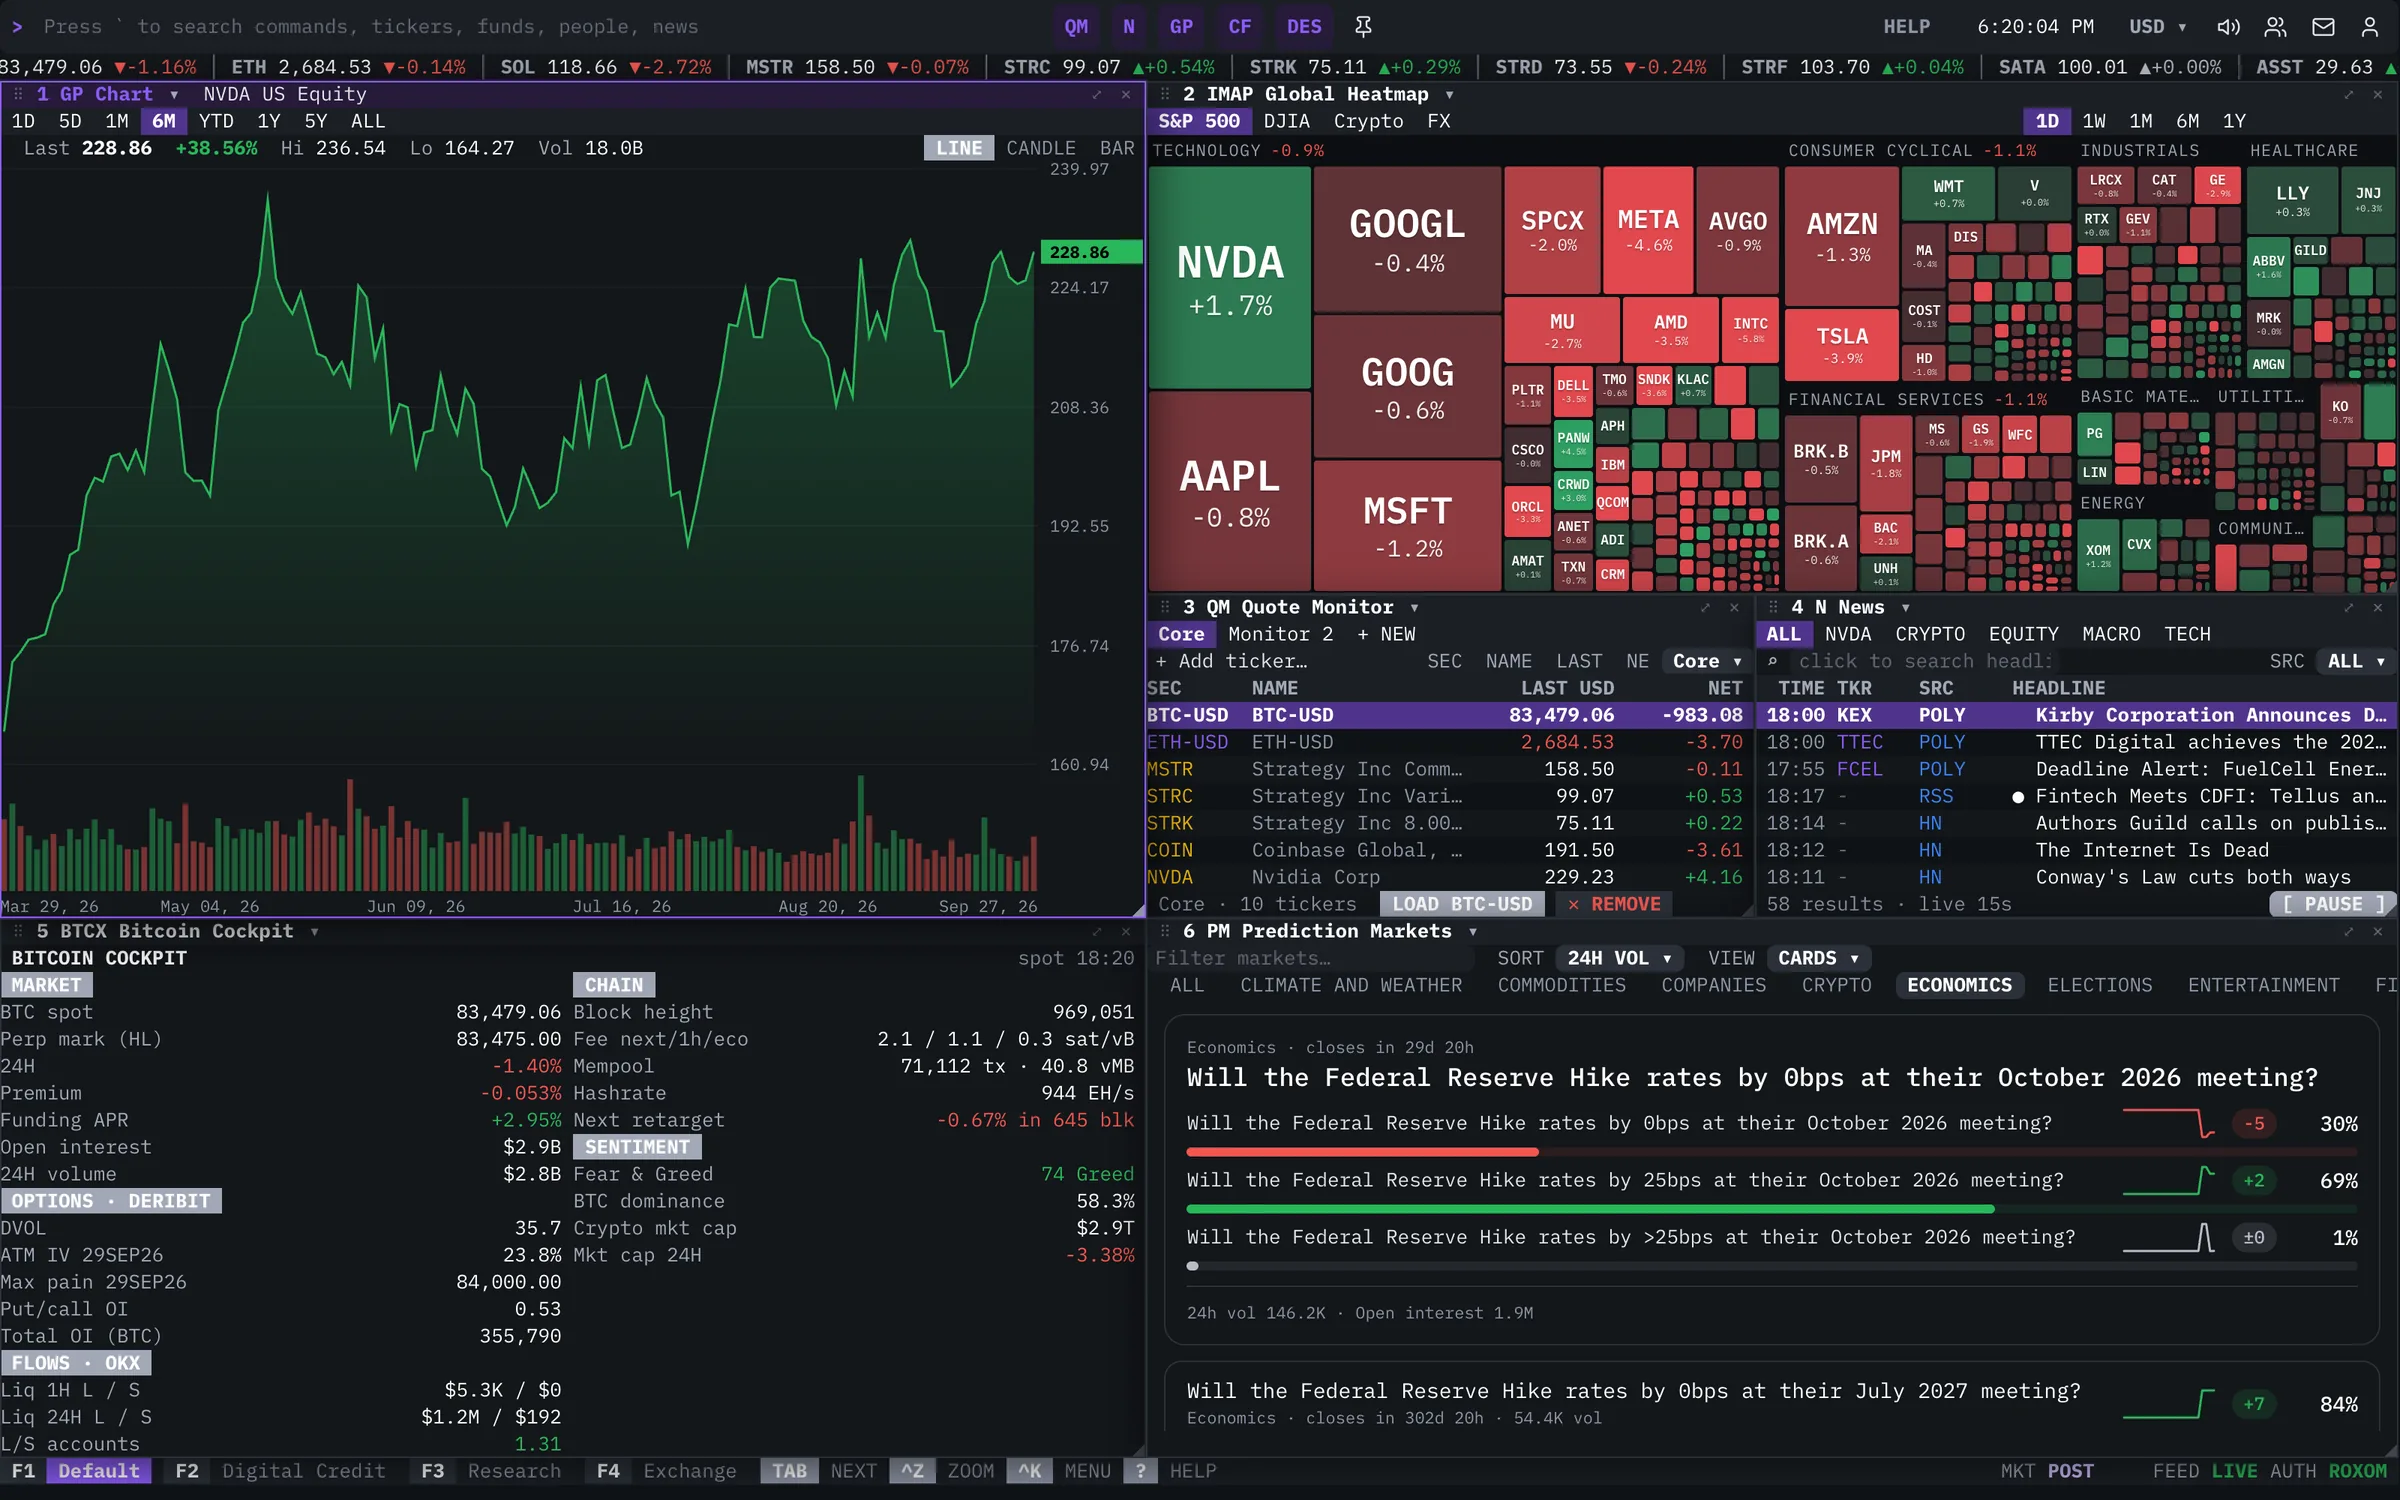
Venues, feeds and streams inside the terminal
Real screens from the terminal. Drag, swipe or use the arrows.
Price graph
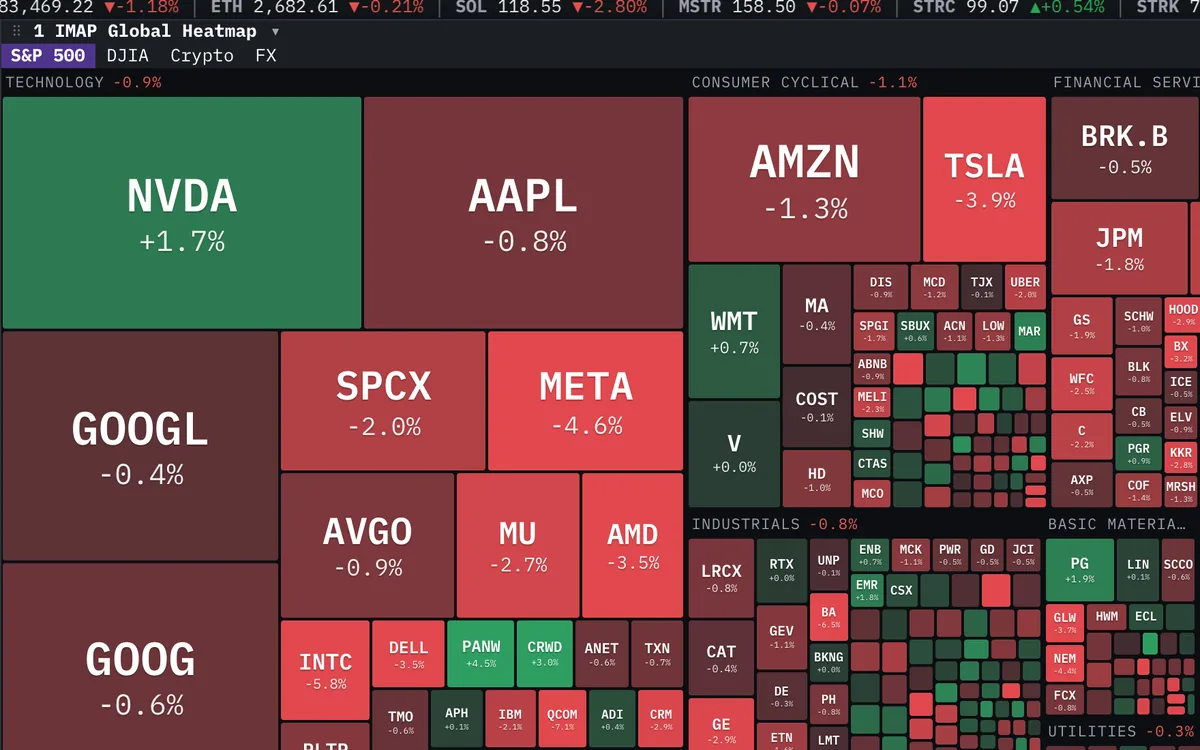
% change map
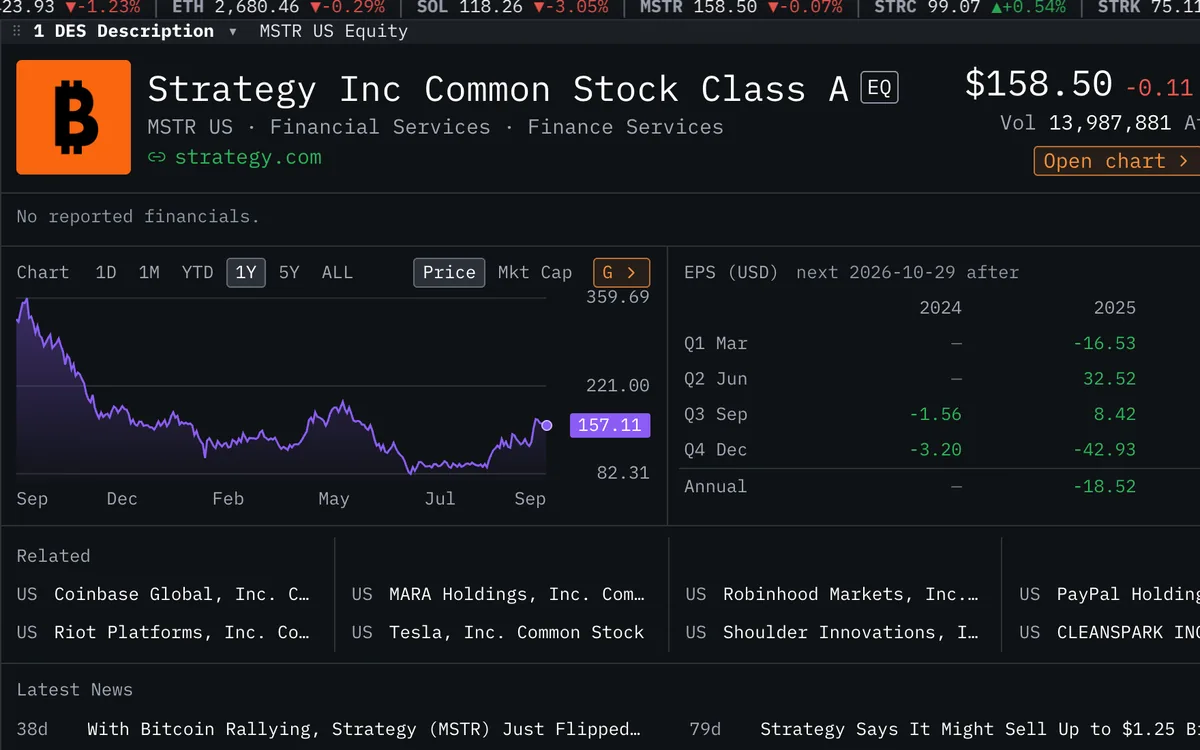
Company profile
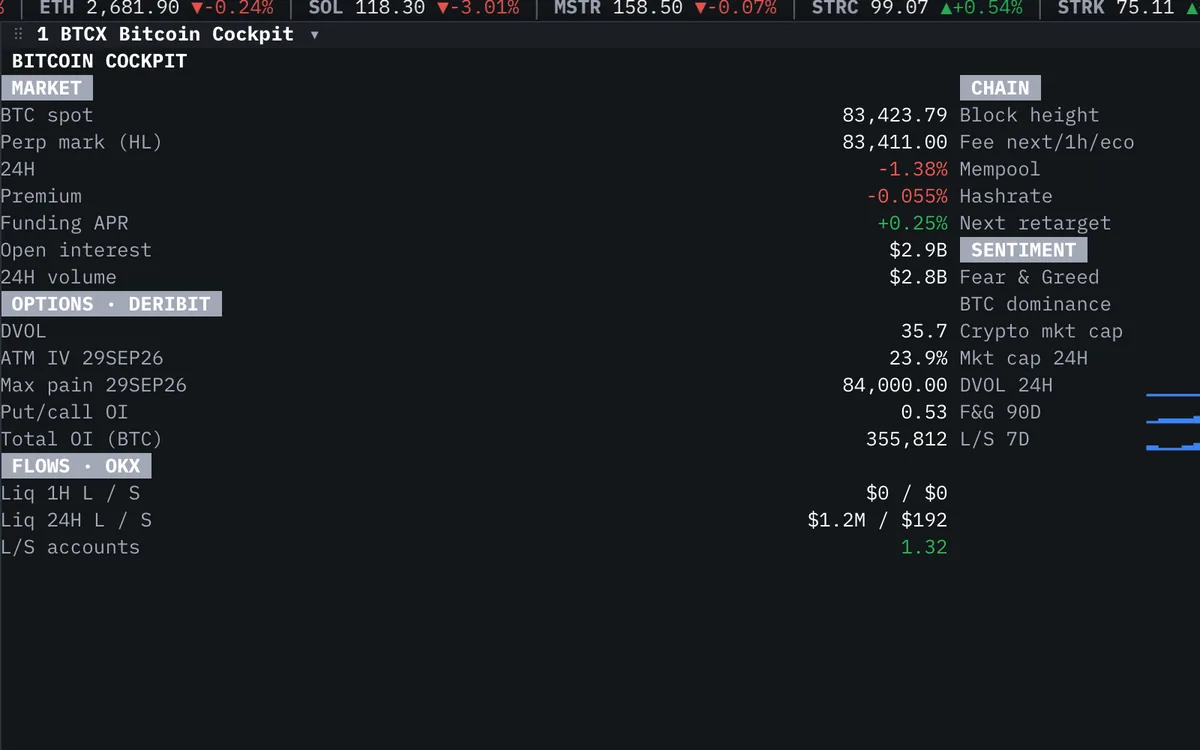
Spot · perps · options · liquidations · chain · sentiment
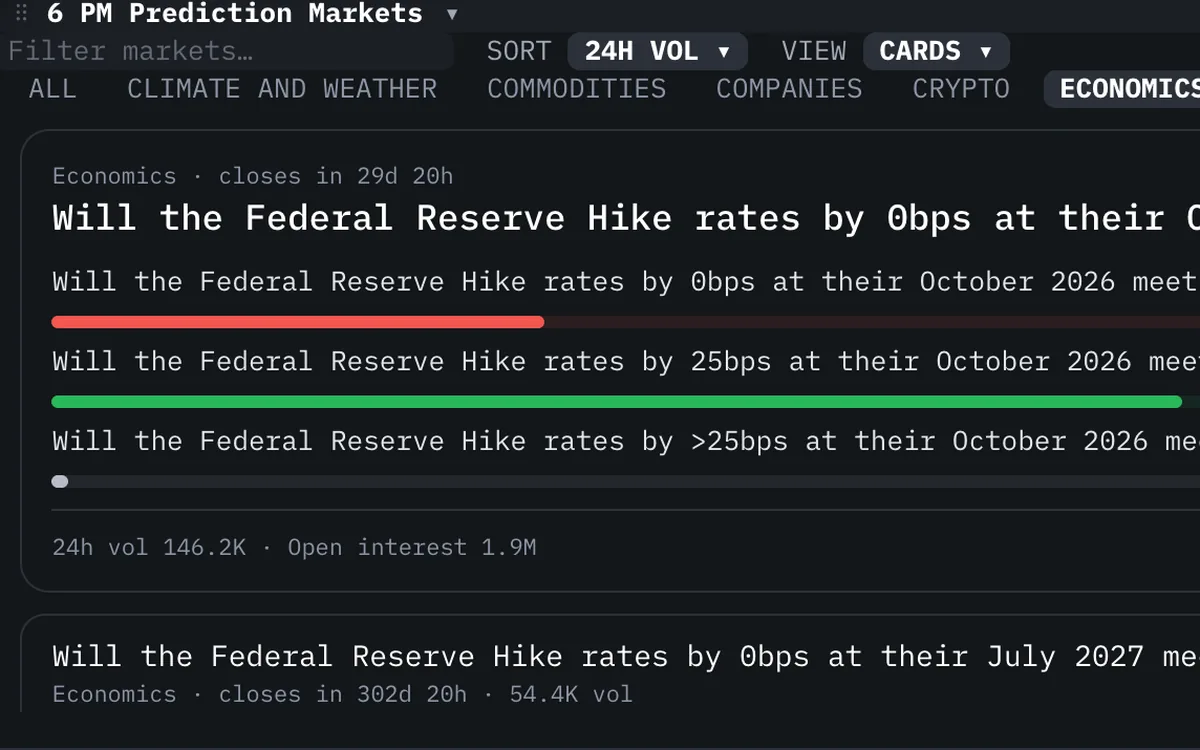
Markets · Yes % · volume · OI
Treasury-backed instruments
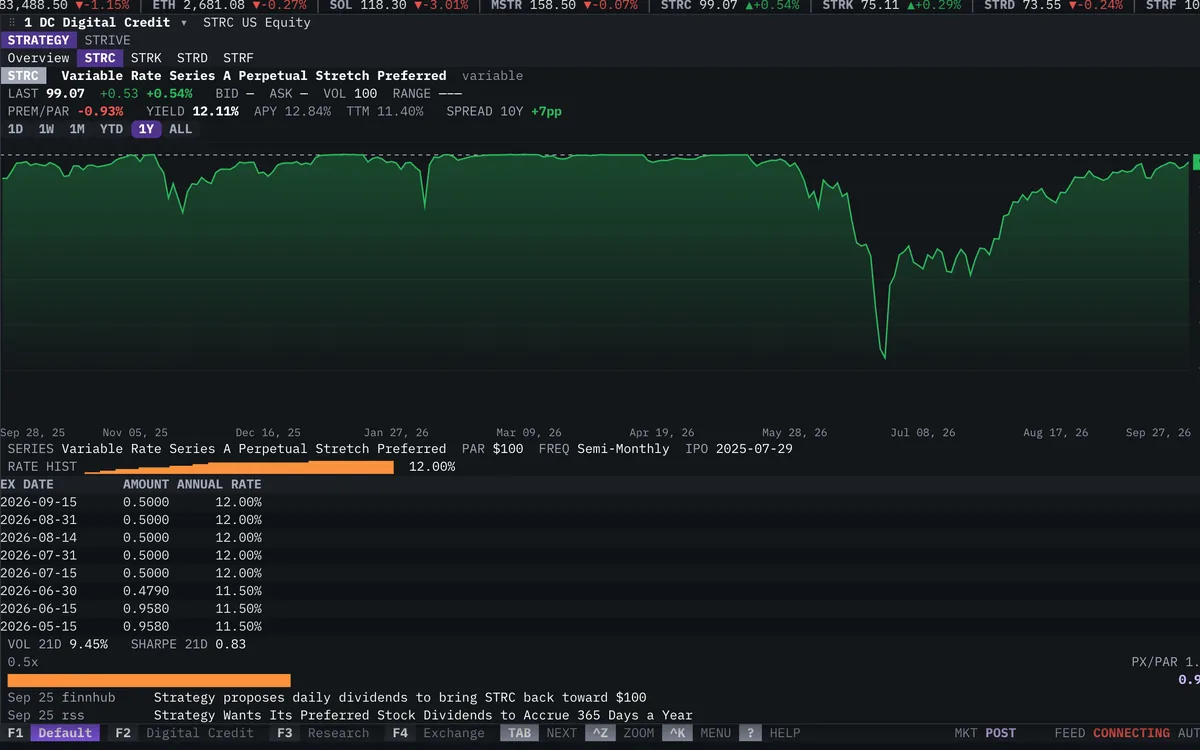
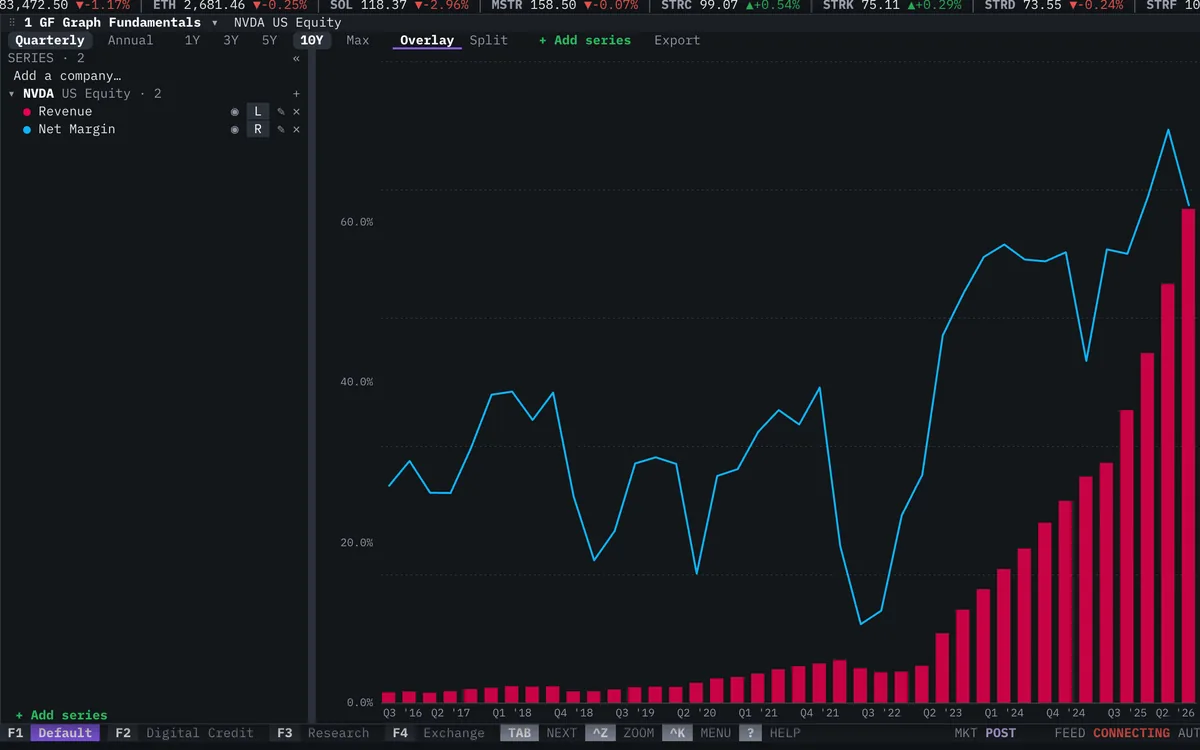
Chart company fundamentals over time and compare across companies
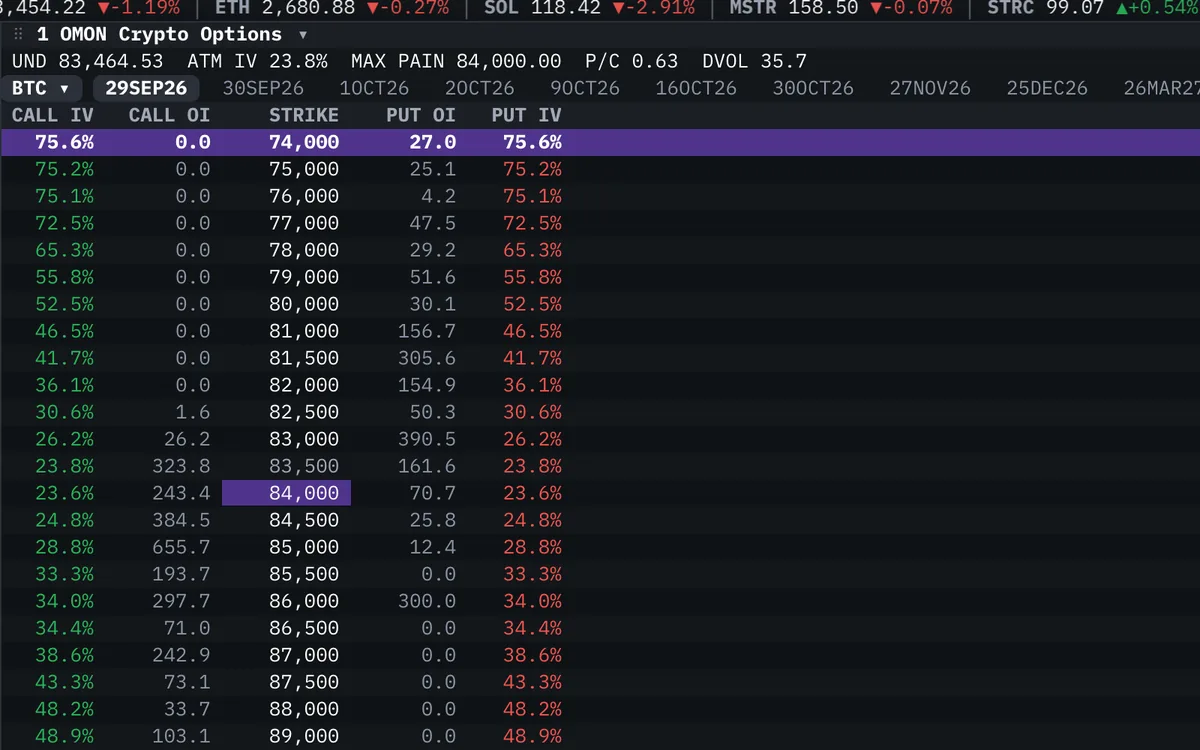
6-venue chain · IV · OI · GEX · max pain · term
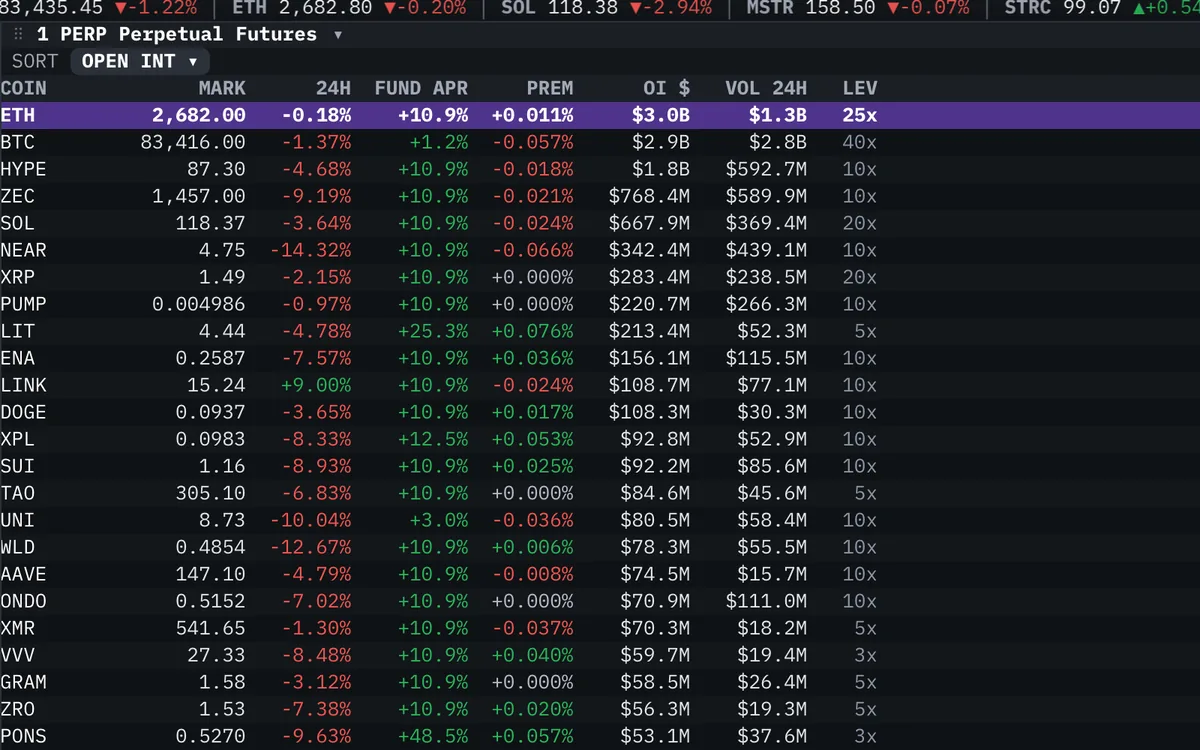
Hyperliquid perps · funding · OI · premium
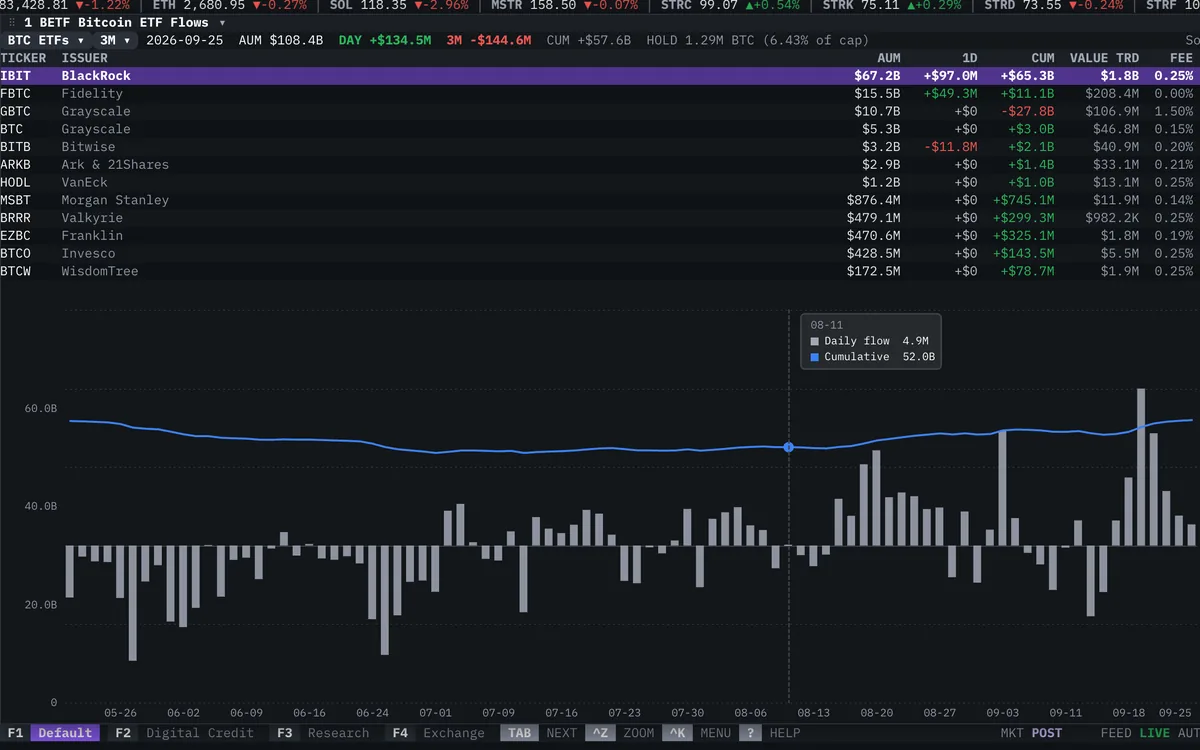
US spot Bitcoin ETFs · AUM · daily + cumulative flows · 1M–ALL
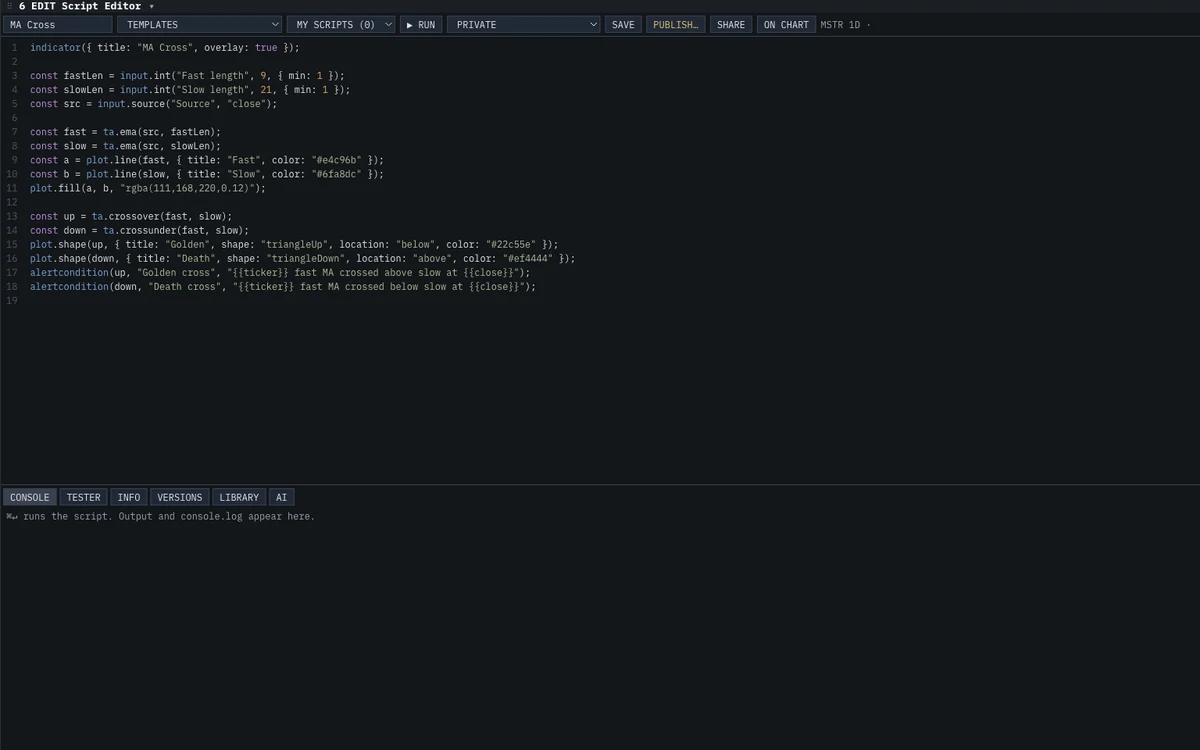
Write TypeScript indicators & strategies · backtest · library
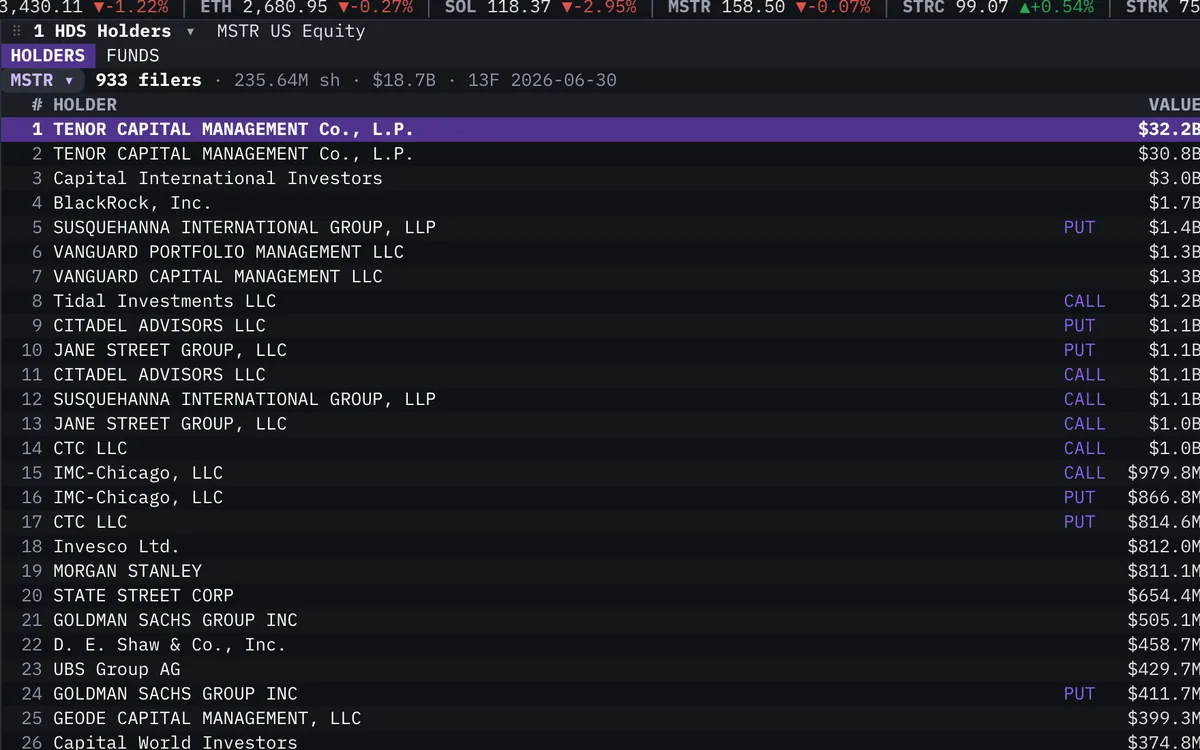
13F institutional holders · every fund's portfolio
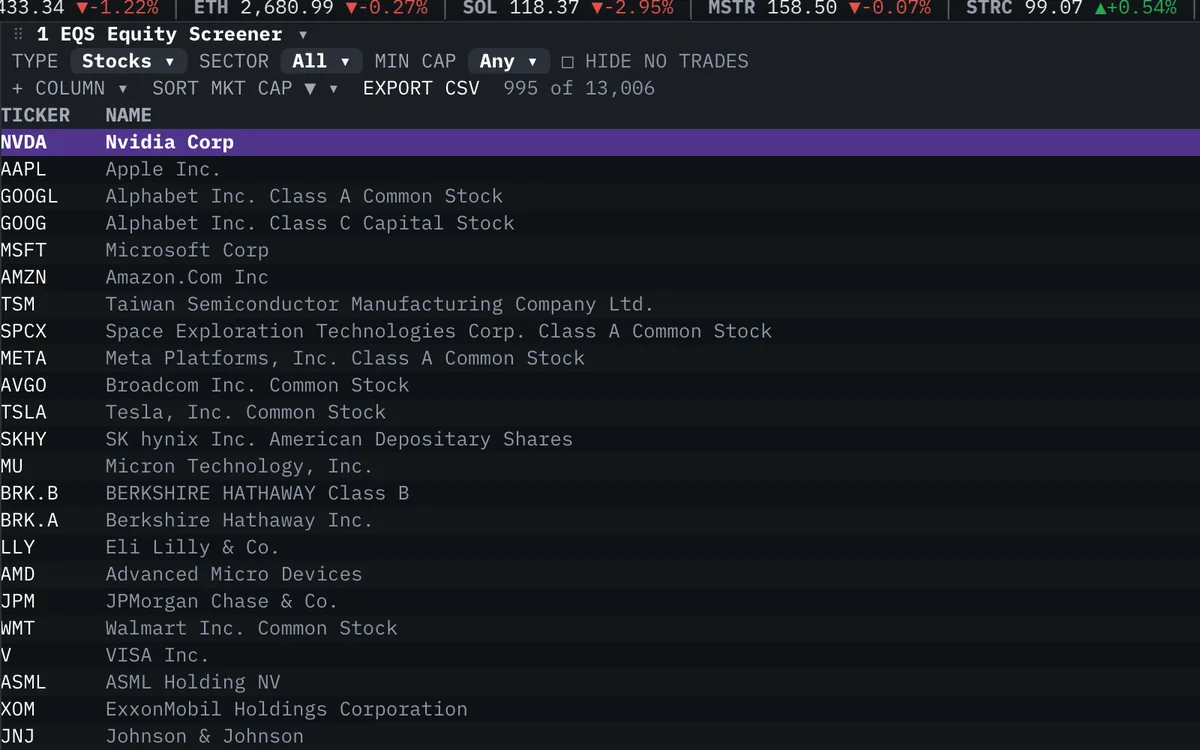
Filter · sort · pick columns · export
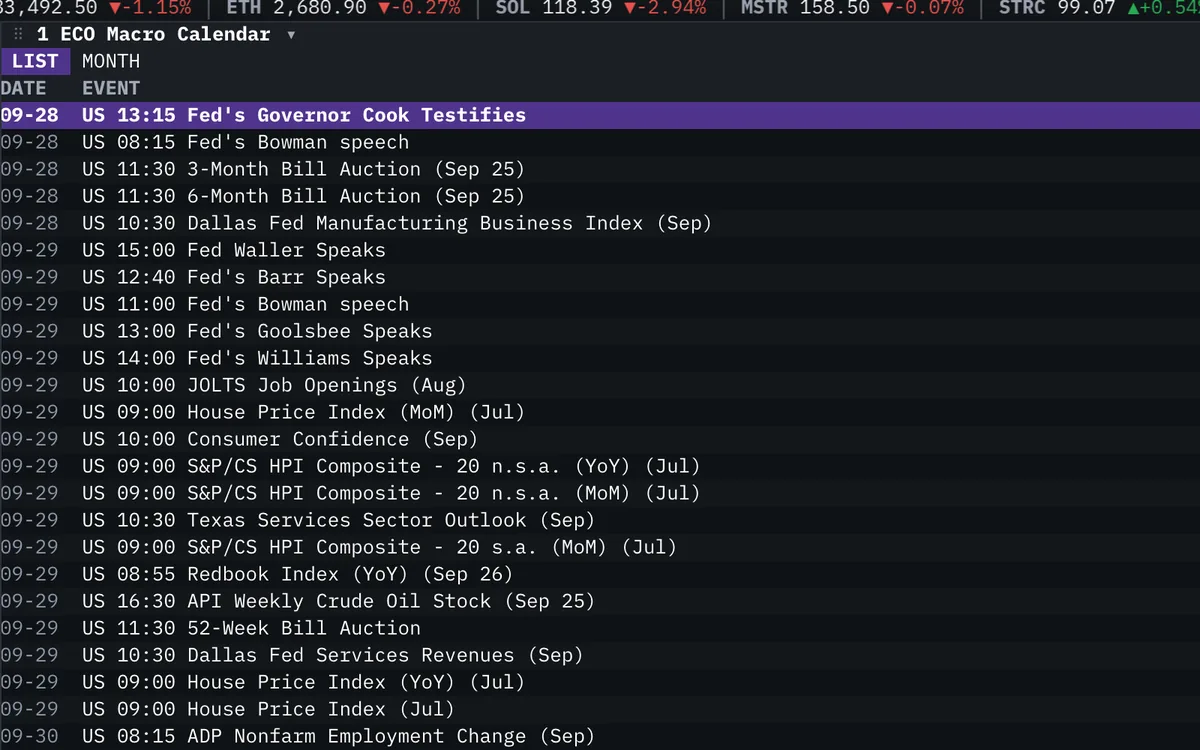
Economic releases · list · month
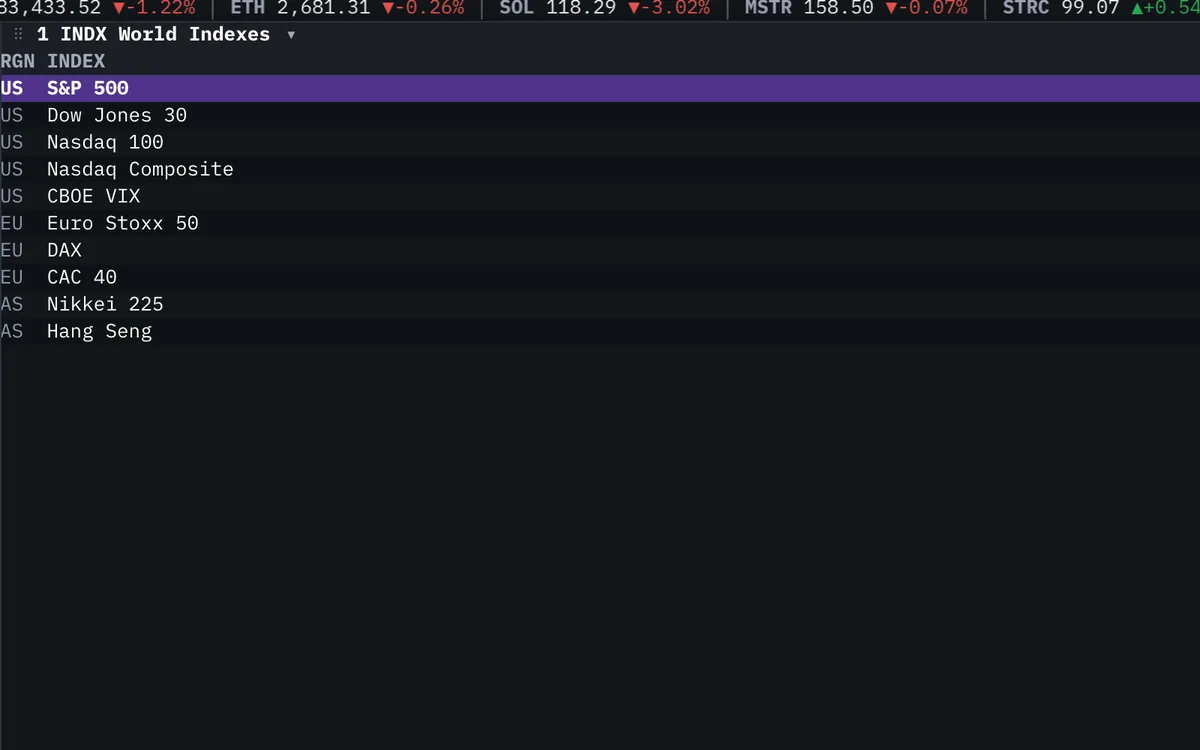
S&P · Dow · Nasdaq · VIX · Stoxx · DAX · CAC · Nikkei · HSI
Type any ticker. Every linked window follows it.
Profile, chart, holders, news: one mnemonic each.
Open a ticket, review, and trade on Roxom.
Pro, Charts and the Roxom Exchange share one login, one data feed and one set of balances. Find it in one, trade it from any of them.
The keyboard terminal. Every function a mnemonic away, linked windows that follow one ticker, and layouts saved to your account.
Open the terminalOur own charting engine. Split layouts, bar replay, drawings and indicators, priced in dollars, bitcoin or sats.
Explore Roxom Charts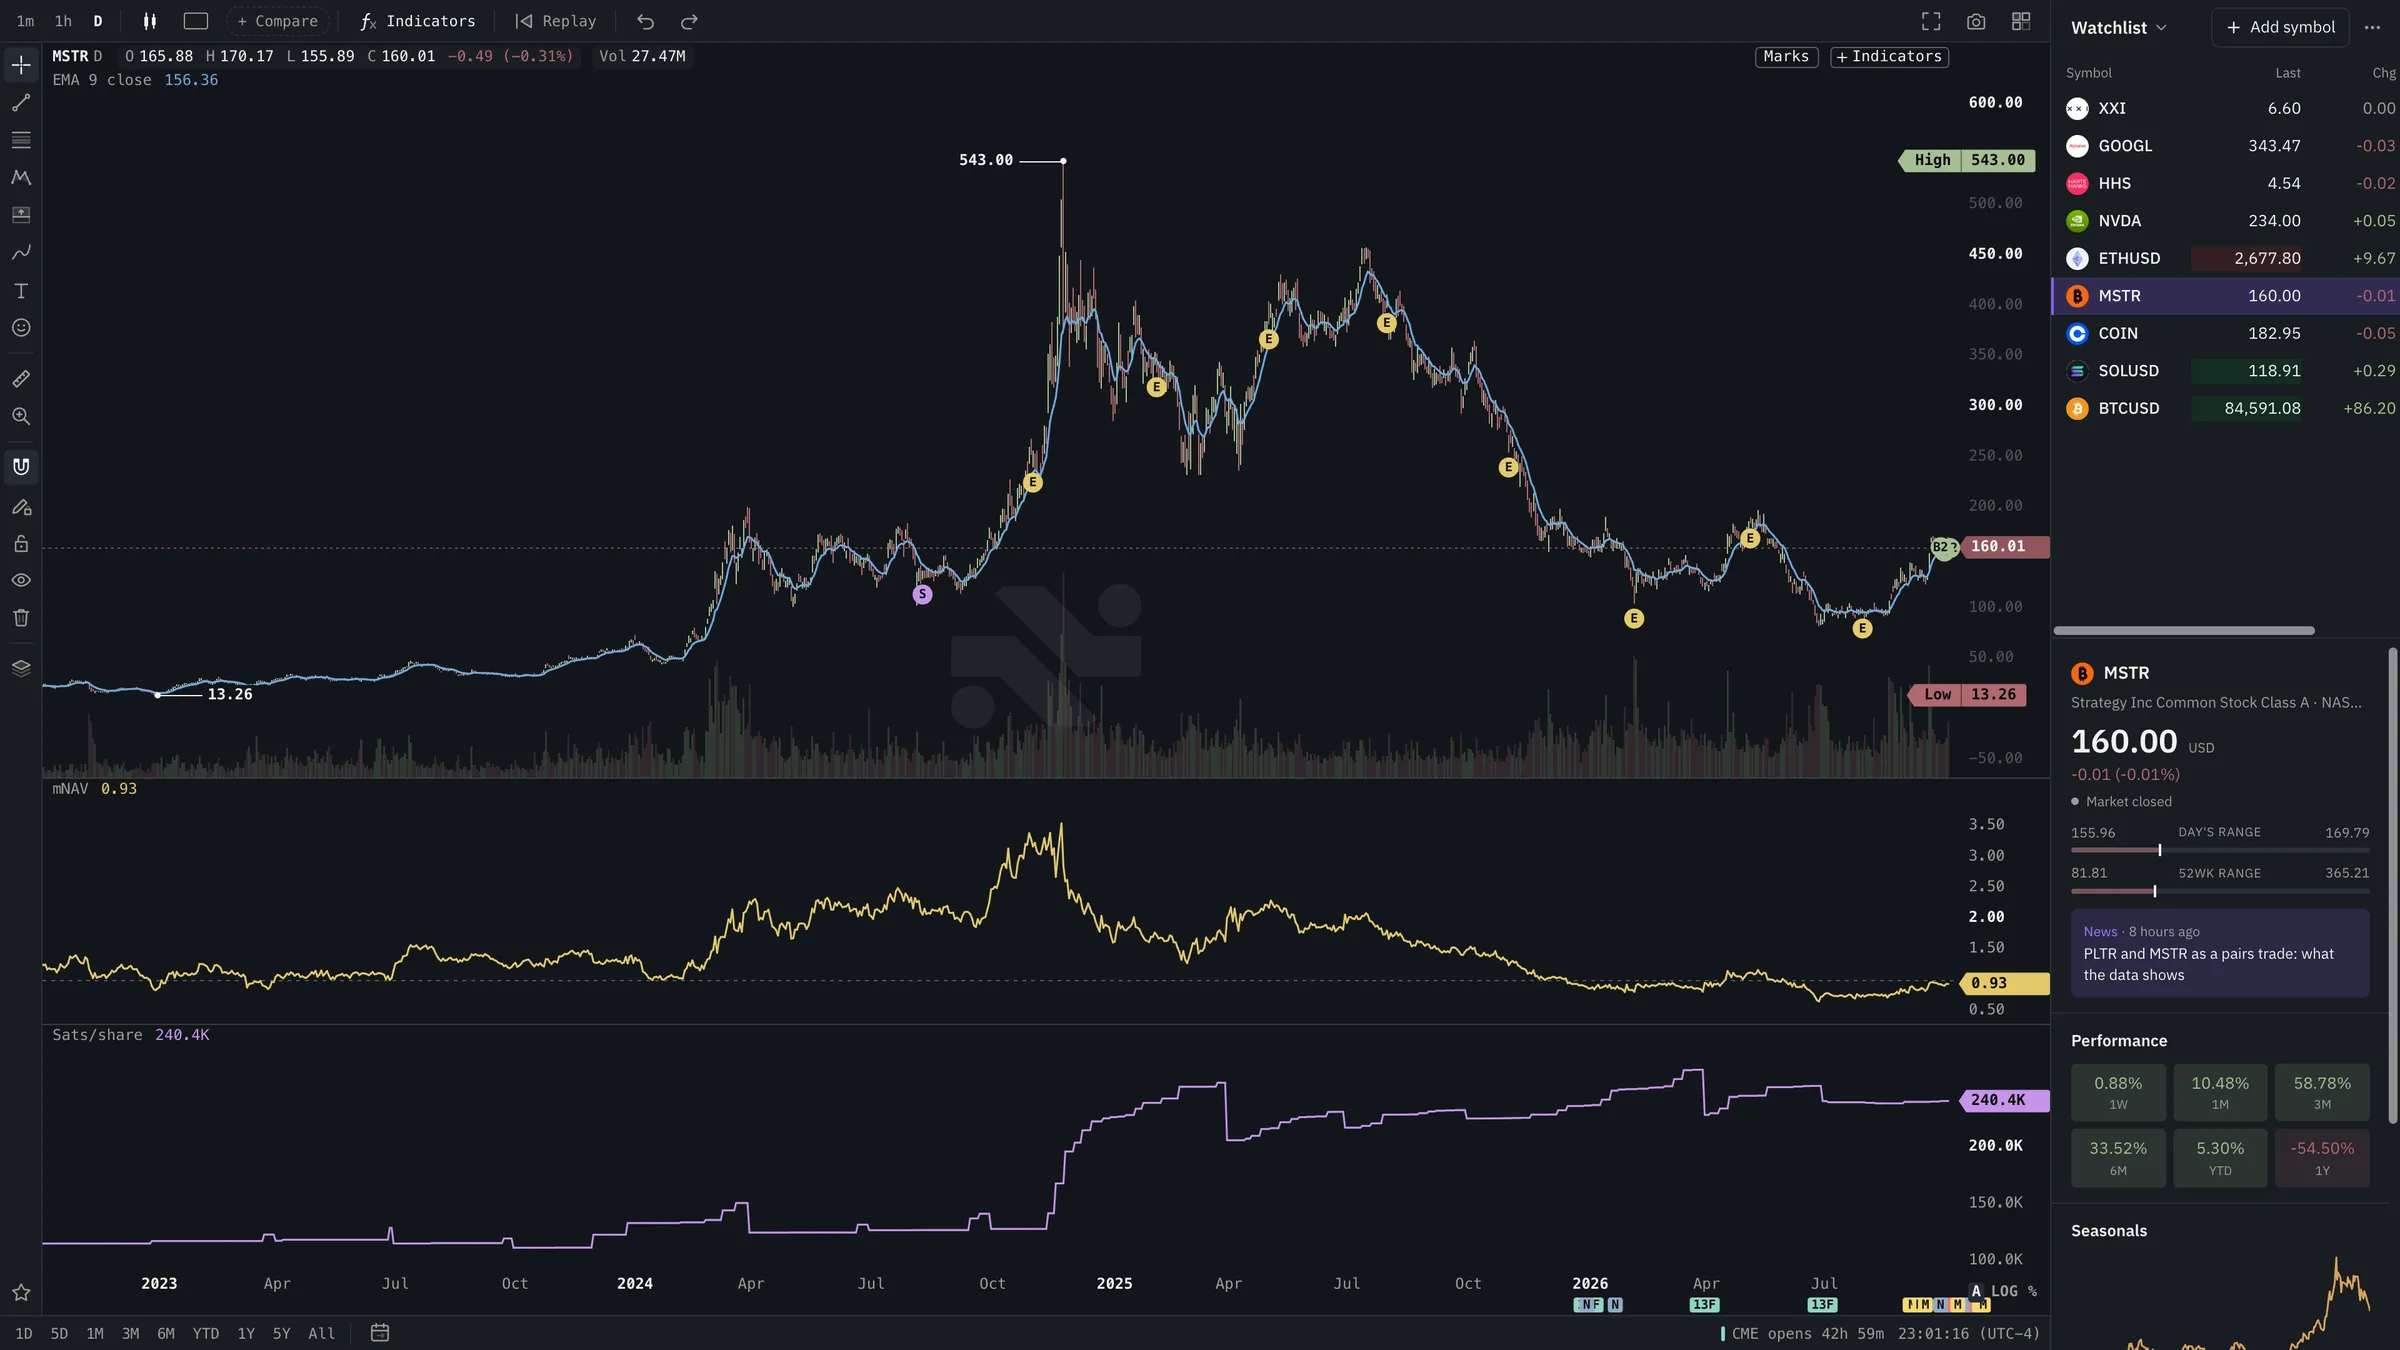
Trade what you find without leaving the screen you found it on.
One data feed behind every window, so the same ticker means the same price everywhere.
US equities with profile, financials, holders, filings and a screener. Build a watchlist and every linked window follows it.
Spot, chain data, liquidations and sentiment in one bitcoin cockpit.
Funding, open interest and premium, around the clock.
Crypto chains across six venues: IV, skew, gamma and max pain.
Polymarket and Kalshi odds, volume and the day's movers.
Economic calendar, FRED series and what is driving CPI.
Browse issues and plot yield against maturity by issuer.
Every company, ETF and government holding bitcoin, plus the daily ETF flows.
The same mnemonics you type in the terminal.
The script editor is built in. Write an indicator, backtest a strategy, then share it with everyone else on Roxom.
A Pine-style API: inputs, ta.*, plots, fills, shapes and alerts.
Paste a TradingView indicator and run it on any Roxom chart.
Set capital, sizing, commission and slippage, then run it on any symbol.
List indicators and strategies free or paid on the public store.
indicator({ title: "MA Cross", overlay: true });

const fastLen = input.int("Fast length", 9, { min: 1 });
const slowLen = input.int("Slow length", 21, { min: 1 });
const src = input.source("Source", "close");

const fast = ta.ema(src, fastLen);
const slow = ta.ema(src, slowLen);
const a = plot.line(fast, { title: "Fast", color: "#e4c96b" });
const b = plot.line(slow, { title: "Slow", color: "#6fa8dc" });
plot.fill(a, b, "rgba(111,168,220,0.12)");
Alert fired
Golden cross
BTC-USD · 1h · example
Fast
EMA 9
Slow
EMA 21
Plot
Overlay
Or free, if you hold $20,000+ at Roxom.
Roxom Pro
$30/ month
14-day free trial · card required
Roxom clients
$0/ month
while you hold $20,000+ at Roxom · no card
Pro unlocks on its own when you qualify. No trial clock.
Deposit to qualifyThe quick answers.
